
The Neutroon Platform.
The Neutroon Platform is the software behind every Neutroon Watchdog. It defines tests, computes KPIs, evaluates SLAs, raises incidents and exposes dashboards and APIs. Watchdogs run standalone — or combined with infrastructure monitoring for full-stack assurance.
From the probe to your NOC.
One pipeline from the radio edge to your operations stack — with optional infrastructure inputs feeding the same platform.
Probe
Indoor or rugged outdoor hardware at the point of use.
Watchdog Agent
Edge runtime: schedules tests, switches operators, buffers locally.
Neutroon Platform
Ingestion · KPI engine · SLA thresholds · incidents · APIs.
Neutroon UI / your NOC
Dashboards, alerts and APIs pushed to your operations stack.
Private 5G / LTE network elements
Core and RAN telemetry from your private network.
DAS
Distributed Antenna System health and alarms.
Correlated into the same KPI engine, SLA thresholds and incidents.
Define once. Run everywhere. Report continuously.
The same four-step loop drives every probe in your fleet.
Define
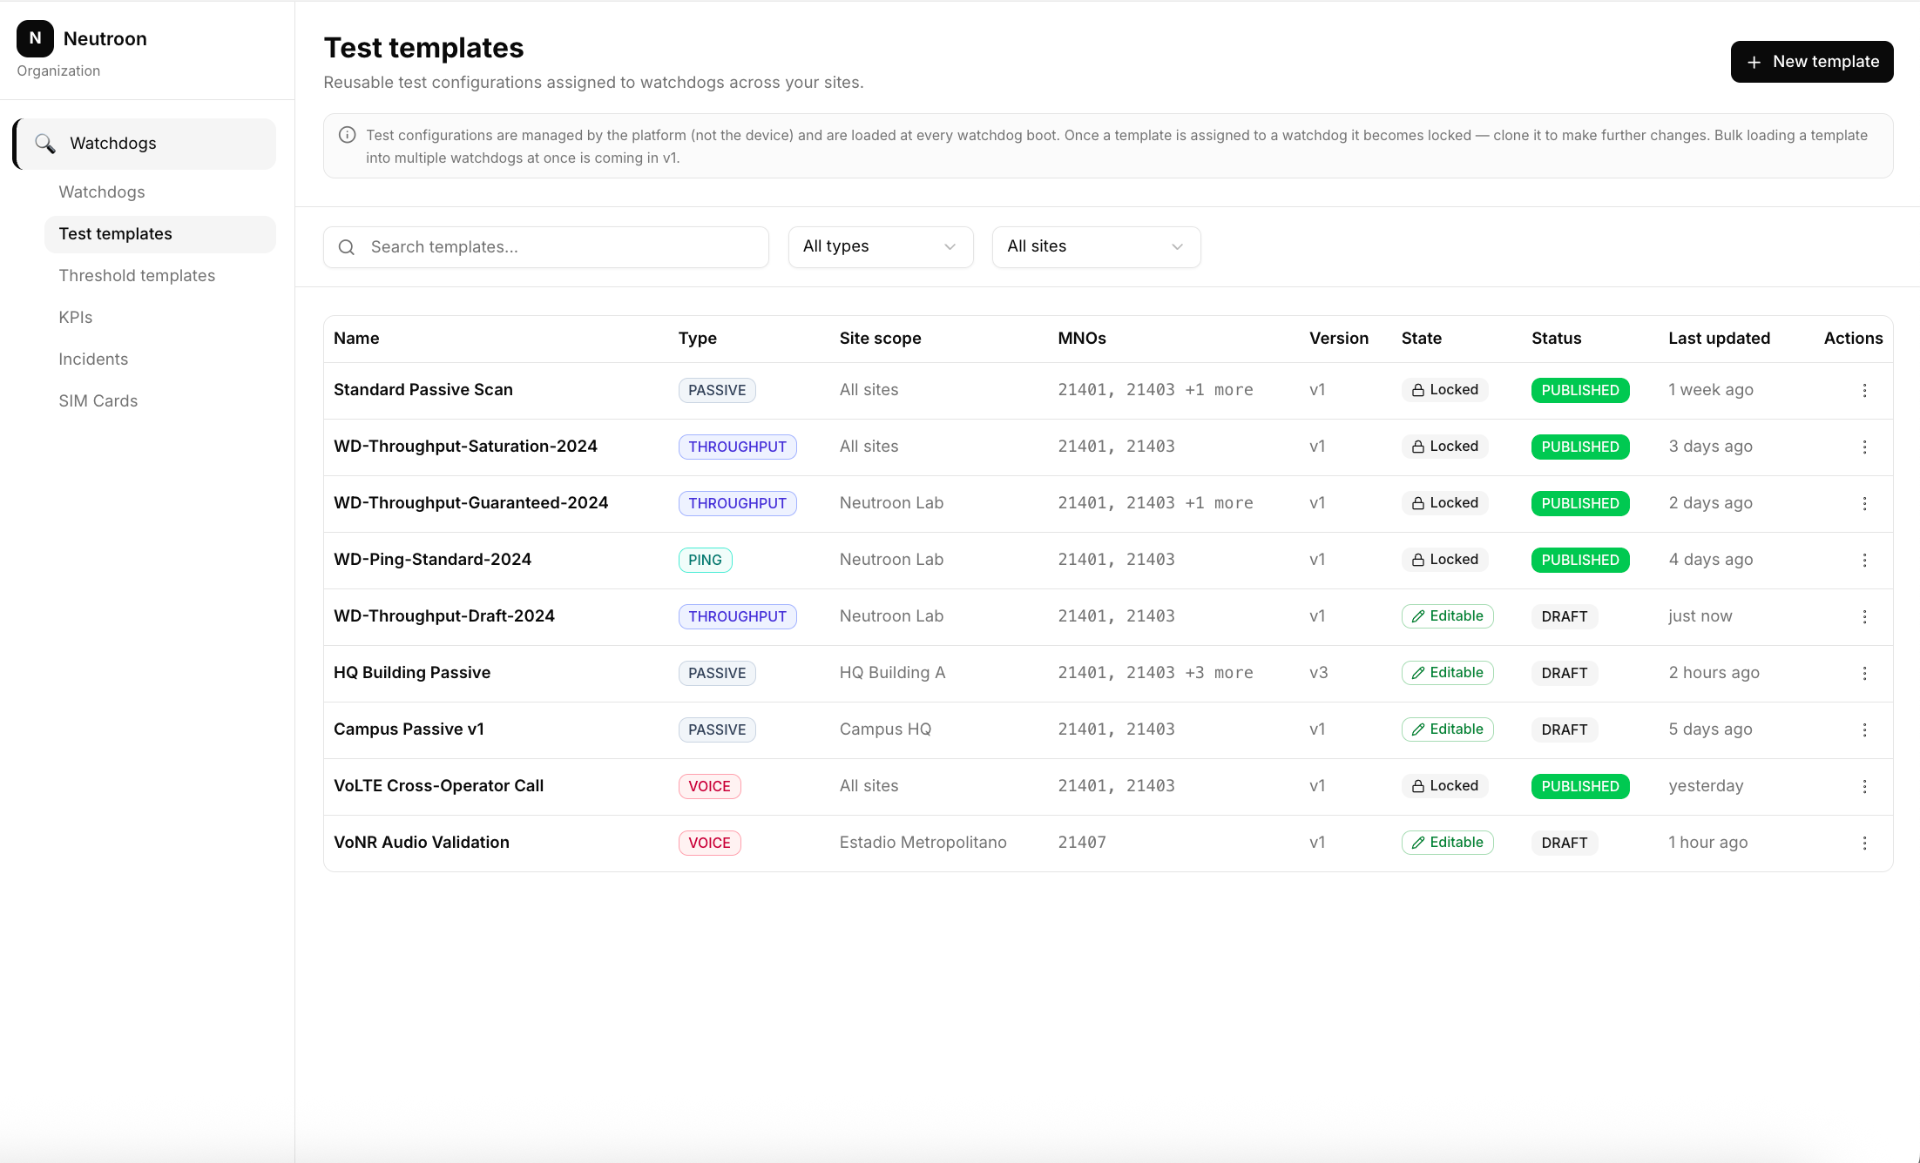
Build templates in the Neutroon UI or API — tests, schedules, thresholds.
Distribute
Templates pulled by every Watchdog Agent over HTTPS — no inbound ports.
Execute
On-device scheduler runs the queue across operators, slices and apps.
Report
KPIs, SLA state and incidents stream back to dashboards and your NOC.
Every layer of the experience — measured.
Radio, transport, voice and application — captured continuously from the same probe.
Passive
RSRP and RSRQ for every cell and operator the cellular module detects — no SIM required.
- RSRP per cell / operator
- RSRQ per cell / operator
Serving-cell & active
End-to-end transport KPIs measured against a SIM attached to the live network.
- DL / UL throughput
- Latency
- Jitter
- Packet loss
- Availability
- CQI
- BLER
- SINR
- PCI
- Cell ID
- Band / ARFCN
Voice (VoLTE / VoNR)
Per-call telephony KPIs across the IMS voice stack on every supported operator.
- Call-setup, alerting & session timing
- Call-drop rate
- Negotiated codec
- RTP / RTCP jitter & packet loss
- eMOS / MOS
App QoE
Real-device Android measurements of the most-used consumer apps over the live network — search, social / short-video, streaming, messaging, maps and AI assistants.
- Per-app response time (user-perceived load latency)
- Time to first content / first frame
- Throughput
- Data volume
- Error rate
- Connection stability (drops, Wi-Fi ↔ cellular switching)
- OTT calls (Teams, WhatsApp, Zoom): audio quality (MOS)
- OTT video / streaming (YouTube): TTFF, bitrate / throughput, rebuffering
Automatic SLA evaluation. Actionable incidents.
From raw KPI to ticket: thresholds, severity, dedup and evidence — without operator intervention.
Thresholds become incidents
Per-KPI SLA thresholds turn into auto-created incidents with severity, deduplication and full evidence trail.
Fleet & map view
See every probe at a glance — by site, operator, slice or tenant. Drill from fleet to single probe in one click.
Floor-plan markers
Indoor probes are pinned on building floor plans, so degradation maps directly to physical locations.
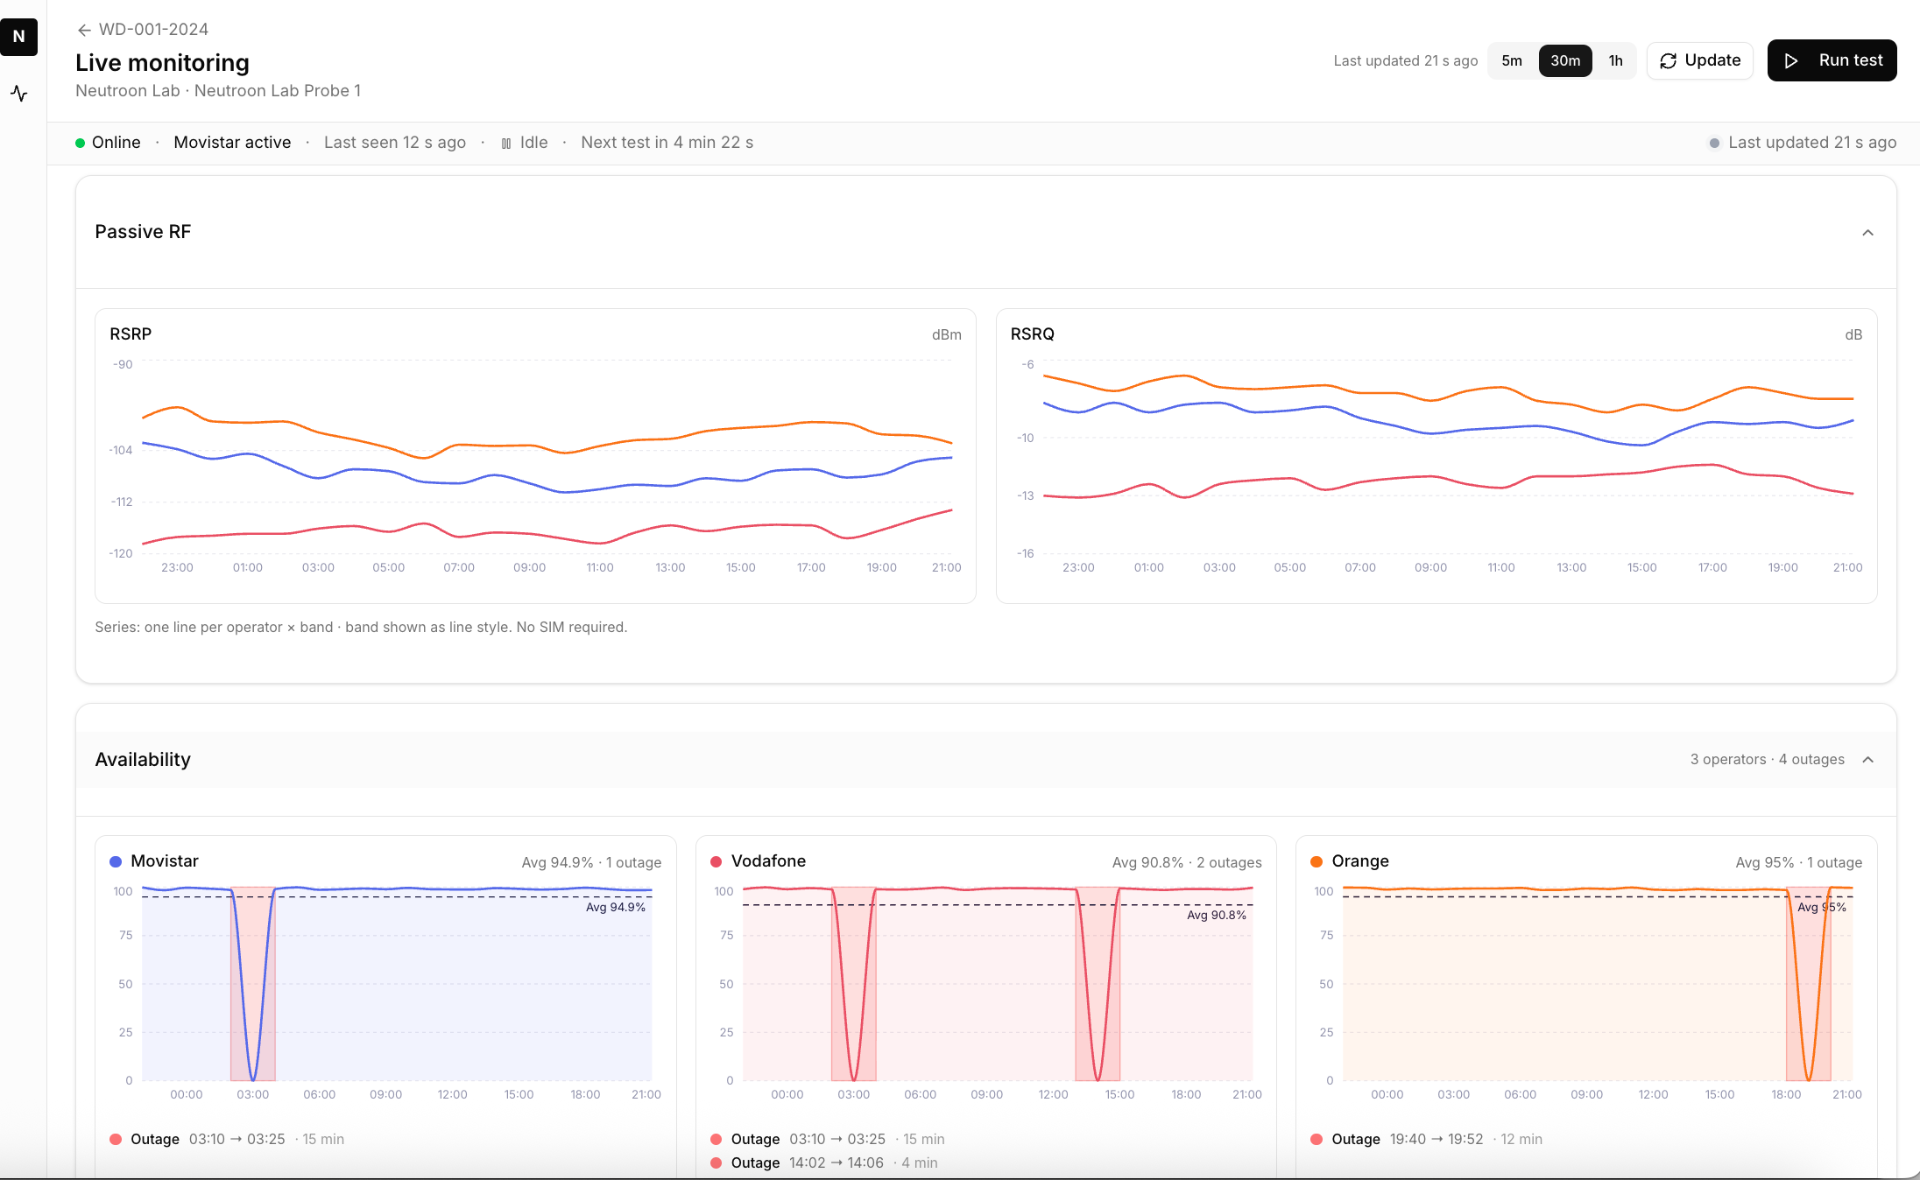
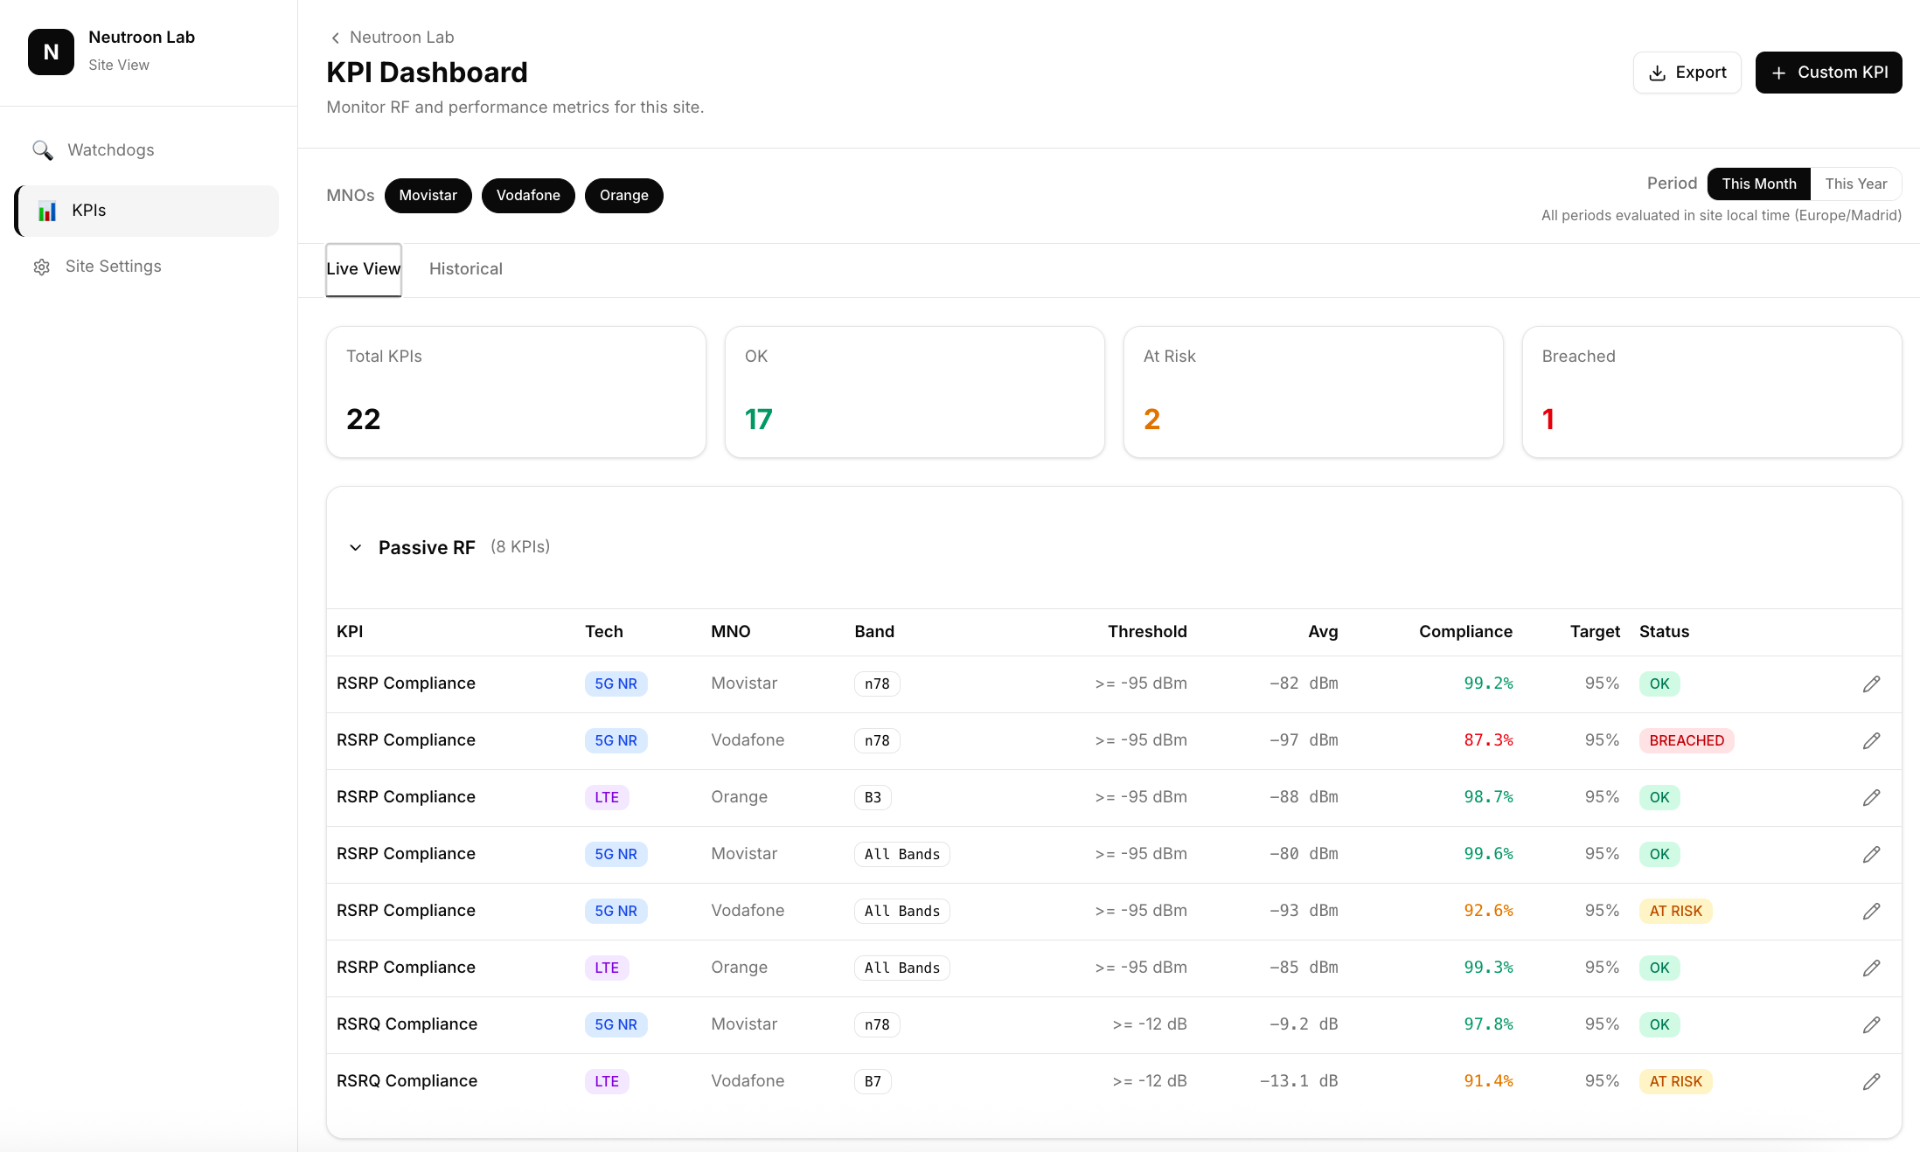
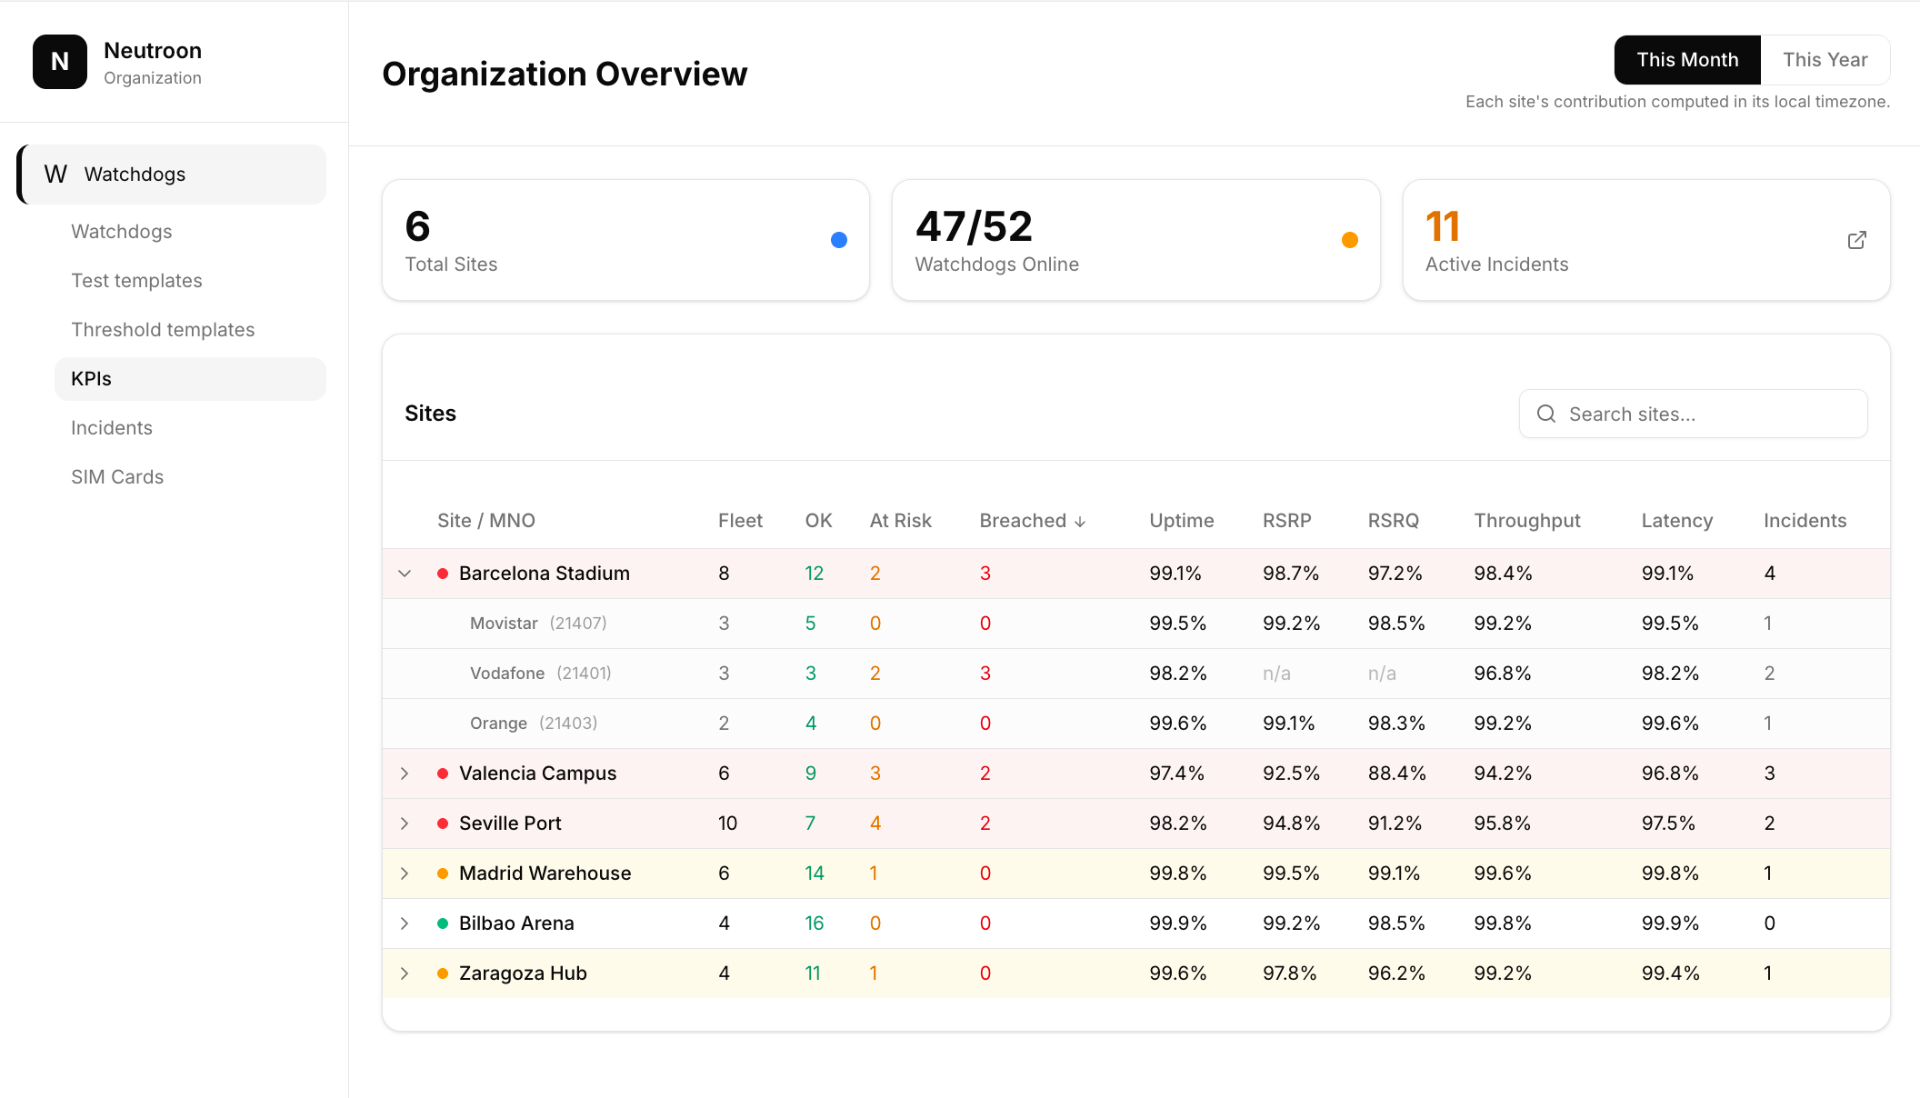
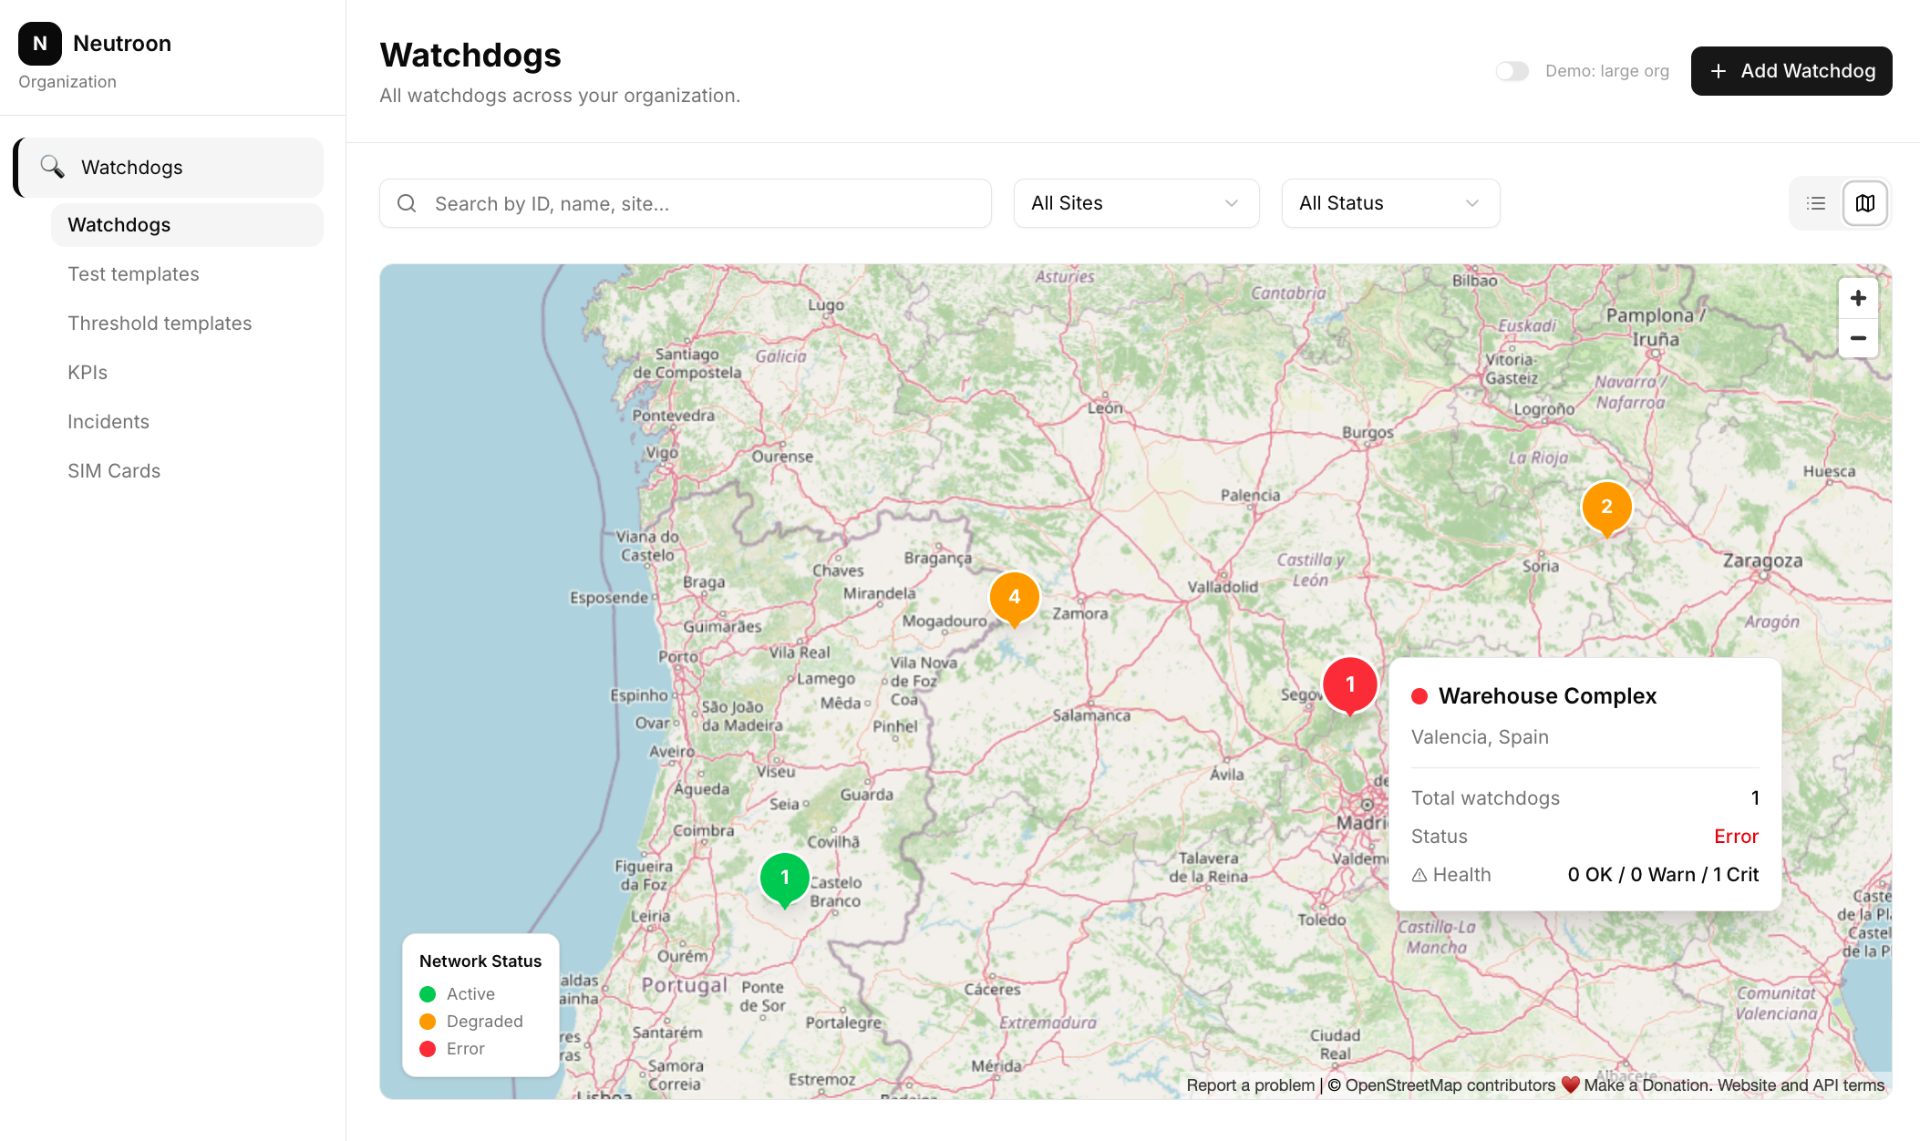
Live monitoring — passive RF and per-operator availability
Hardened for mission-critical operations.
TLS everywhere
All probe-to-platform traffic protected with TLS. Outbound HTTPS only — no inbound ports on the probe.
Device authentication
Every Watchdog authenticates to the platform with per-device credentials before any telemetry is accepted.
Secure eSIM SGP.32 provisioning
Encrypted profile download with LPAe / LPAd AT-command authentication — operator switching without site visits.
Local buffering
On connectivity loss the agent buffers measurements locally and replays them when the link returns.
Built to scale
Scales to thousands of probes per tenant — multi-tenant isolation across operators, venues and customers.
MCP-ready
Native Model Context Protocol server so AI agents can securely access live assurance data and trigger workflows.
An assurance layer agents can read and act on.
The Neutroon Platform exposes a Model Context Protocol server over its API. AI agents can securely query live RF, performance and incident data, trigger active tests, and drive autonomous root-cause analysis workflows — turning continuous ground truth into closed-loop operations.
MCP server over the platform API
Agents connect via a standard Model Context Protocol interface to read KPIs, incidents, passive RF and active-test results — and to trigger tests on demand.
Autonomous root-cause analysis
Agents correlate multi-operator KPIs, passive RF and active probes to pinpoint why an SLA breached — not just that it did.
Closed-loop workflows
From signal to action: agents can open incidents, request new test runs and feed findings back into your NOC and ITSM.
Model-agnostic
Works with any MCP-compatible assistant. Tested with Anthropic's Claude — no vendor lock-in.
Standalone or full-stack assurance — one platform.
The Neutroon Platform supports two operating modes. Start standalone, evolve to full-stack whenever you're ready.
Probe-only assurance
Deploy Watchdogs alone — no core or RAN access required. Ideal for MNOs, neutral hosts and any environment where you assure networks you don't operate.
- No core / RAN integration needed
- Every operator from one probe
- Objective, user-level SLA proof
Add infrastructure monitoring
Combine Watchdog telemetry with Private 5G/LTE and DAS infrastructure monitoring on the same platform — to correlate user experience with infrastructure health.
- Private 5G / LTE network elements
- DAS health and alarms
- One dashboard, one incident model
See the Neutroon Platform on your network.
Run a Watchdog standalone, or layer in full-stack infrastructure monitoring — on the same platform.